In the first part of this series we used the AWS IoT Core, configured Amazon Timestream and presented a python script for the Raspbery PI, which uploaded OBD-Data using an ELM327 compatible interface and GPS data by NMEA0183 to the AWS IoT Core. In the second part we configured the Raspberry PI to run run the script as a service and to use a read only filesystem, so that it’s easier to use in a vehicle. What is still missing is a comfortable way to plot the data from Amazon Timestream. In this blog we show how this is working.
Hardware and Software in use
- PC using Debian Linux 11.0
- Grafana 8.4.4 OSS Edition
- AWS IoT Core / Amazon Timestream as configured in “connect your car to IoT using Raspberry PI and AWS”
Installing Grafana
You can get a managed grafana at AWS, but that’s quite expensive. So here we’ll use a locally installed grafana. To install and use grafana there are two options: Either you install it from an apt package and started as a service or we just extract an archive into a directory and start it from there. For the first tests the second option is beneficial. In the official documentation this is called “Install from binary .tar.gz file“. In the documentation you’ll find a link to a download page from which i used the “OSS” version (not enterprise). The direct download link is here. I extracted the archive into ~/tmp:
ralph@debian:~/tmp$ tar -xvzf grafana-8.4.4Next you have to install the plugin for Amazon Timestream. Because you’re using grafana from the local .tar.gz we can not simply use the grafana-cli but have to download the appropriate archive from the Amazon Timestream plugin page (e.g. the linux-amd64 one for the PC with Debian). Next, you have to extract the .zip archive and move the content into the grafana plugin directory:
ralph@debian:~/tmp$ unzip grafana-timestream-datasource-1.5.0.linux_amd64.zip
ralph@debian:~/tmp$ mv grafana-timestream-datasource grafana-8.4.4/plugins-bundled/
After that, you can change into the grafana directory and start grafana:
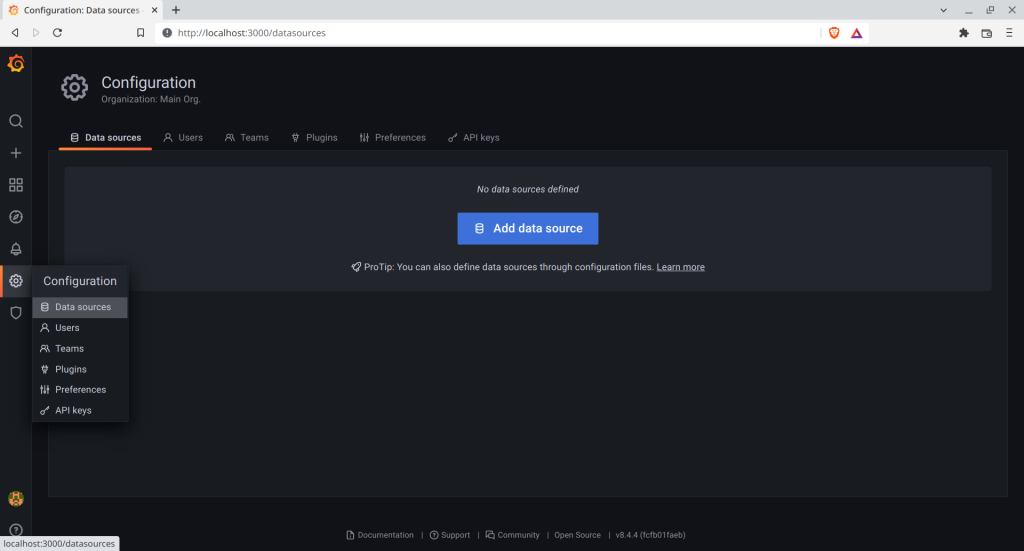
ralph@debian:~/tmp/grafana-8.4.4$ ./bin/grafana-server webAfter starting the grafana-server you can open the URL: http://localhost:3000 in a Browser and you’ll see the grafana start page as shown below. When opening grafana might ask you for a user and password. Default is “admin/admin”. In grafana you open Configuration->Data Sources and then “Add data source” and then select “Amazon Timestream” in “Time Series Database”.
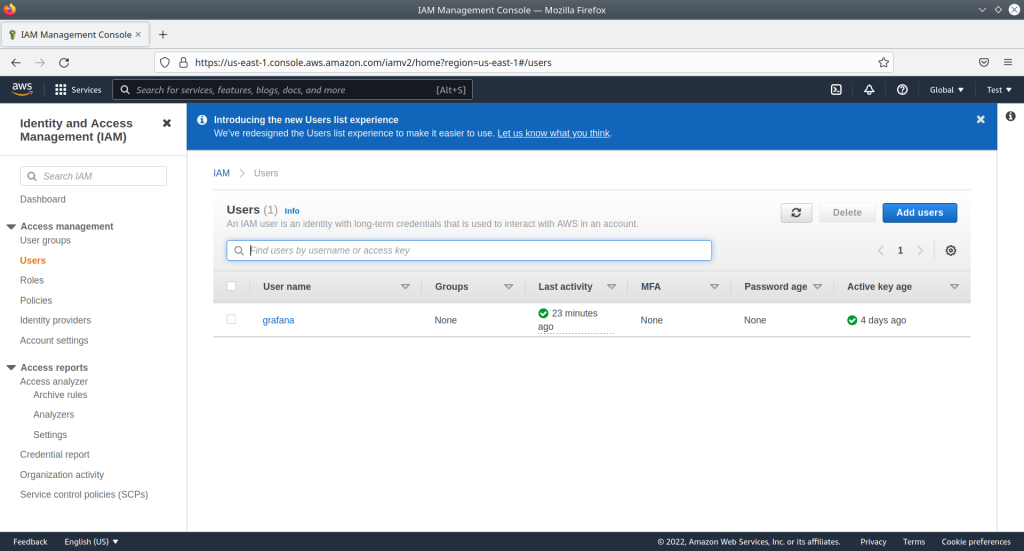
The plugin will ask you for credentials for the Amazon Timestream database. To create these credentials, you have to add a user in AWS. Therefore, you have to log in into AWS Management Console and from there choose Services->Security, Identity & Compliance and then open “IAM”. In the dialog opening you choose “user” on the left side to open the window shown below, and then “add user”.
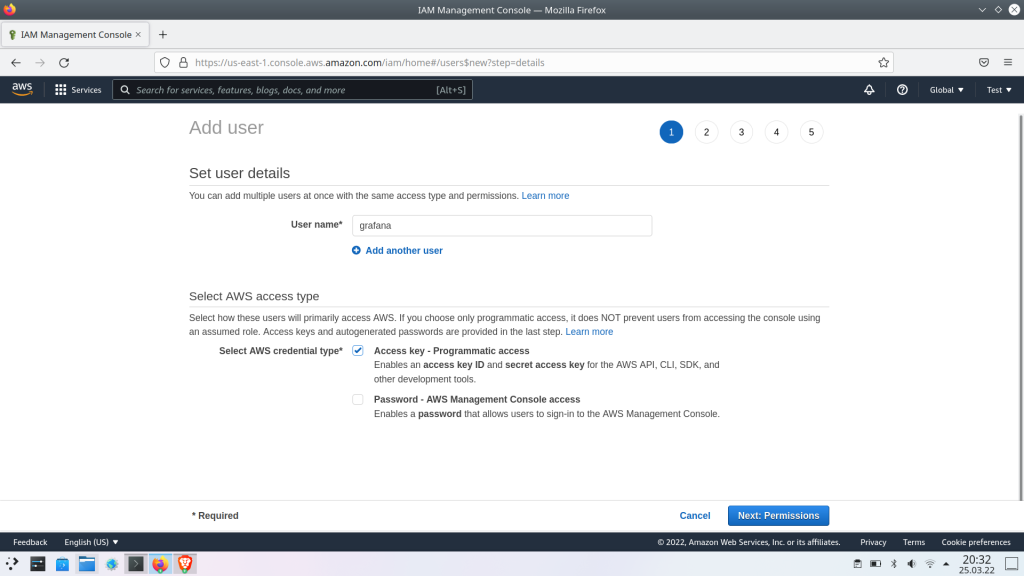
In the next dialog opening you choose a user name (I’ve chosen “grafana” here) and select “Access key – Programatic access” as “credential type”. Then, the dialog should look like this:
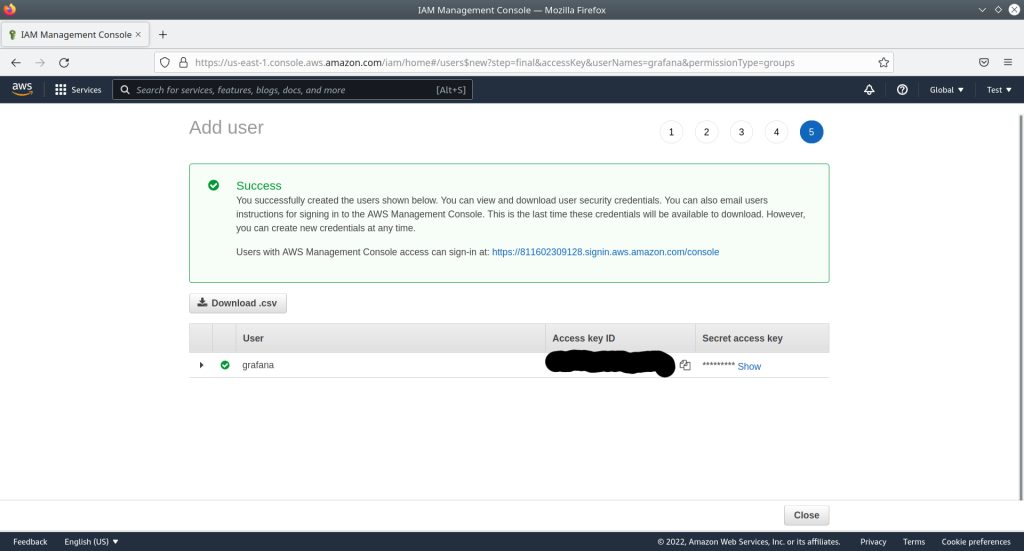
During the following steps 2-4 you can leave the default values. In the final dialog (shown below) you’ll be presented the “Access key ID” and the “Secret access key”. You need both, so you have to copy it or download the .csv file. Be careful: You’ll only have access to the “Secret access key” in this dialog. If you forget to copy it, you can only create a new key later.
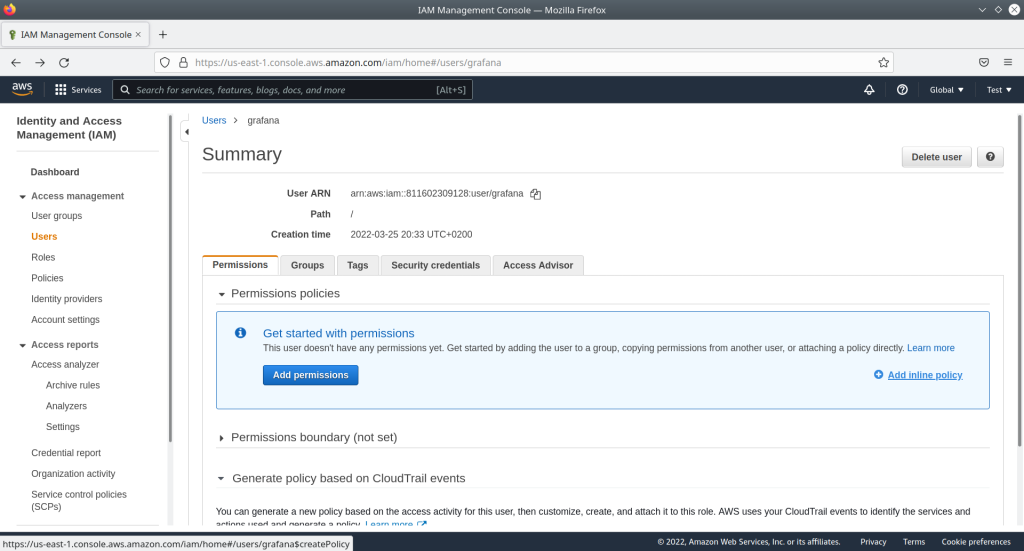
Finally you have to give the new user the required access rights to access the Amazon Timestream database. Therefore, again you open the “Users” menu on the left and then open the user “grafana” just created. The windows shown below will open in which you choose the tab “Permissions” and then “Add inline policy”.
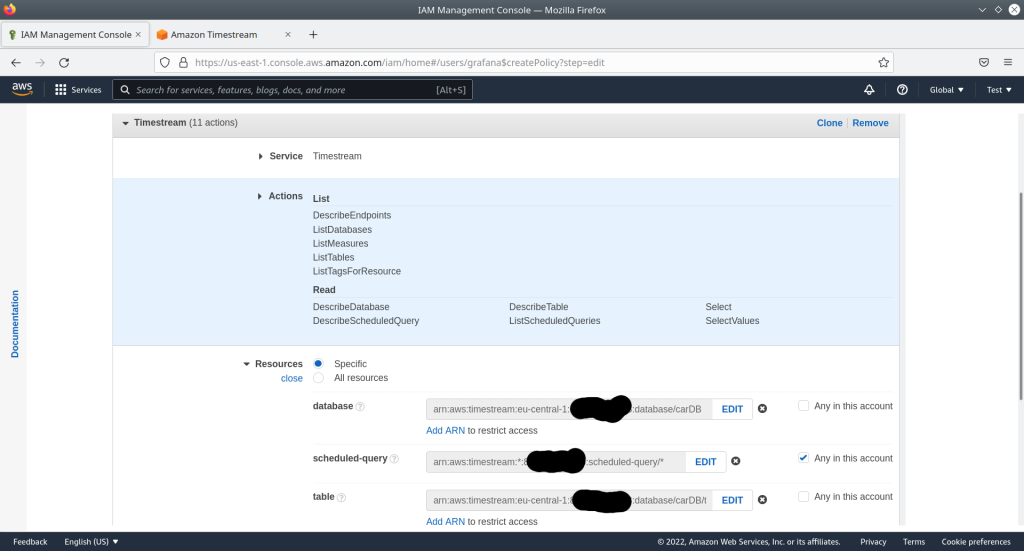
In the dialog opening now in the “Visual Editor” you chose “Timestream” and in Actions->Access level “List” and “Read”. If you only have the one database created in the earlier posts you could just choose “All ressources” in Ressources but it’s more safe to select the specific database and table, what i also did here. Just for scheduled query i selected “All”. After clicking on “Review Policy” you have to give the new policy a name and then it can be added to the new user.
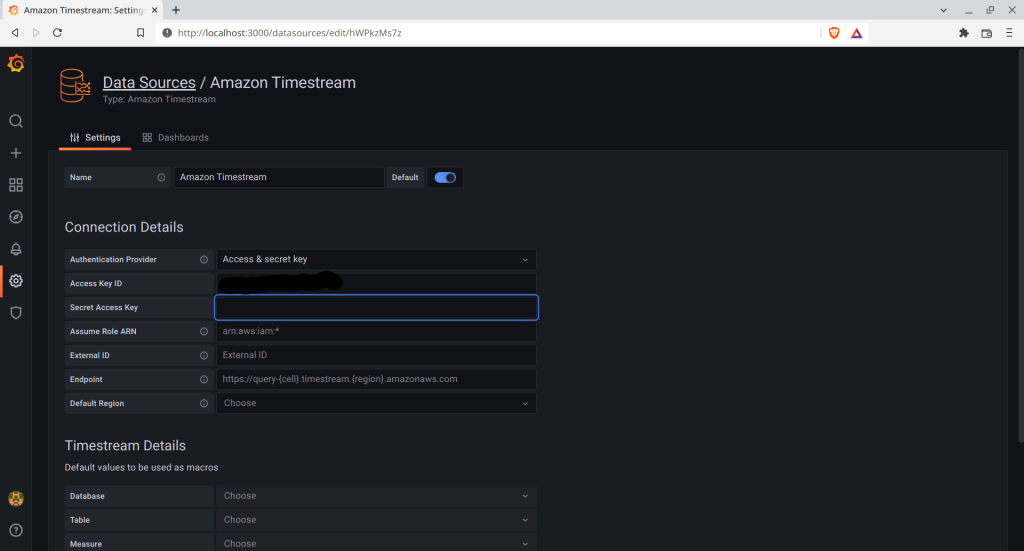
Now, the new user is ready in AWS and can be configured in grafana. Below i’ve shown the window which should still be open from adding the Timestream data source to grafana. For the “Authentication provider” you have to choose “Access and secret key”. For the Access Key ID and Secret Access Key you enter the values you’ve copied or stored in the .csv file during creation of the new AWS user. Finally, you can click on “Save & Test” and the grafana access for the Amazon Timestream database is configured.
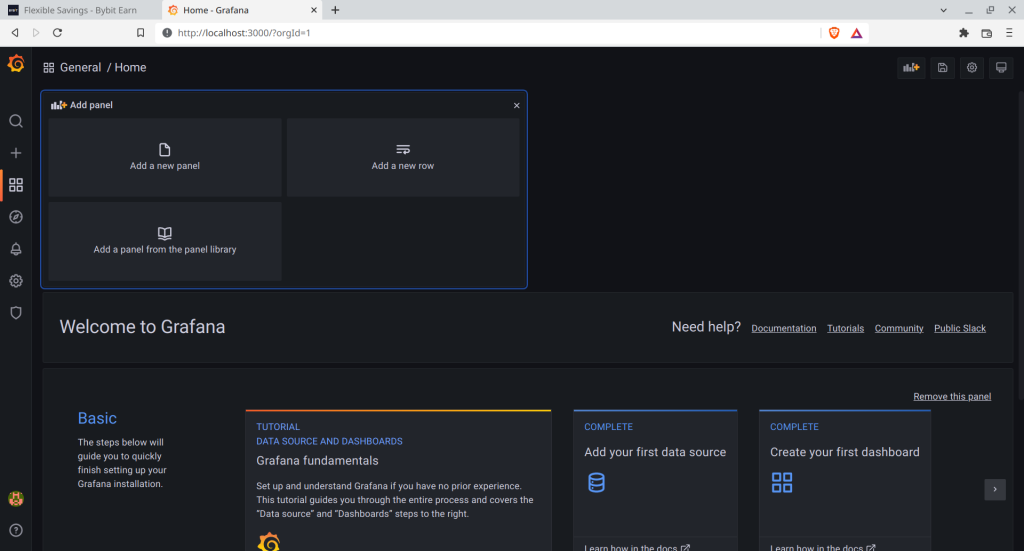
Finally we add a dashboard containing two panels using data from Amazon Timestream to grafana. Therefore, in the home screen of grafana you have to click on “add panel” in the top right. In the window opening which is shown below you again click on “Add new panel”:
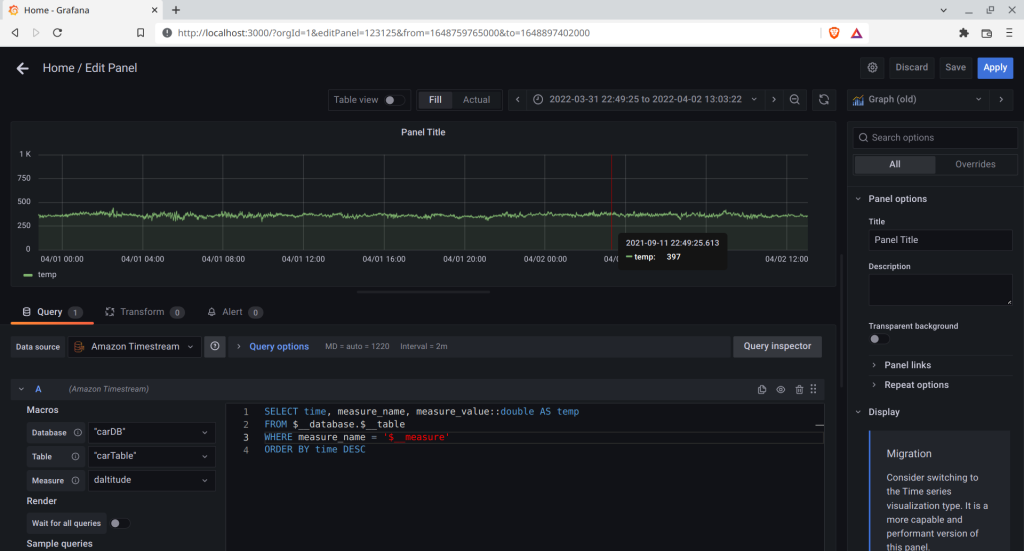
First, we add a panel showing a graph for a time series. Therefore, on the top right you change the visualization type from “Time Series” to “Graph (old”). Next, in the lower left area you chose the database “carDB” and the table “carTable” and in measure you can select which type of data you want to show. Here i chose “daltitude” from the GPS receiver, because i only had to GPS receiver connected to Amazon Timestream during these experiments and the hight channel of the GPS is a pretty noisy measurement which will show some fluctuation even when the receiver is stationary. In the text window right to the data source selection you have to add the appropriate query. The format is similar to SQL. To select all values of the height channel and their time stamp use the following query:
SELECT time, measure_name, measure_value::double AS temp
FROM $__database.$__table
WHERE measure_name = '$__measure'
ORDER BY time DESC
After the query is created, you can click on the “refresh” button (both the arrows in a circle) right above the panel to execute the query again. Left to the refresh button you can choose the time span for which data is shown in the graph. For this example i chose a time frame for which there is some data in the database. Finally, the window should look like shown below and you can save the Graph using the “Save” button on the top right.
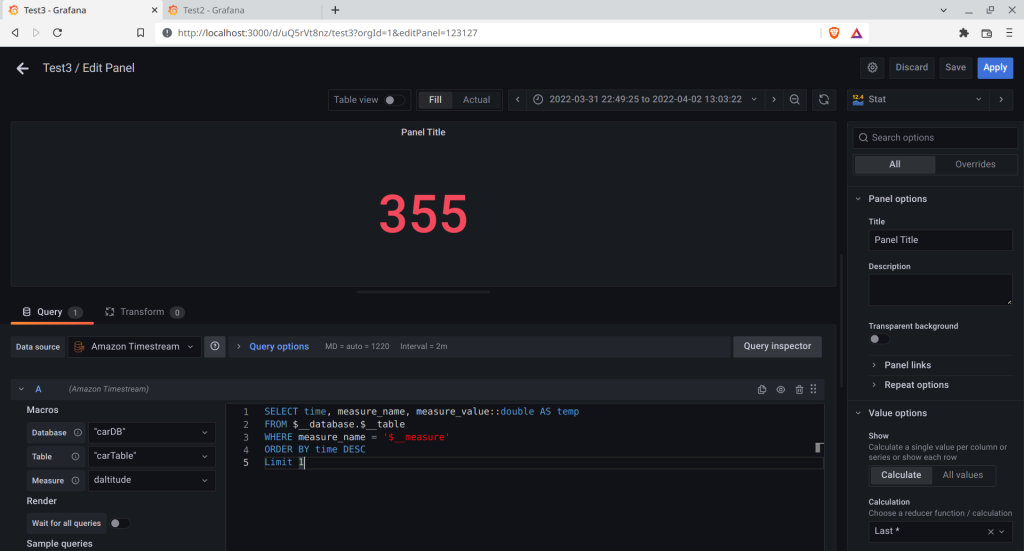
In the second panel, we want to show the current value – or better, the last value stored in the database. Therefore, again you click on “Add a new panel”. This time, as visualization type you choose “Stat”. The data source is configured as for the last panel. Also the query is almost the same, but we have to add a line containing “Limit 1” to get the last value only:
SELECT time, measure_name, measure_value::double AS temp
FROM $__database.$__table
WHERE measure_name = '$__measure'
ORDER BY time DESC
Limit 1
With these setting the configuration should look like on the screenshot below and you can now click on “Save” to store it.
Now the first prototype is complete – we can read OBD and GPS data in a vehicle, sent to Amazon Timestream using the AWS IoT Core and visualize the data from Timestream using grafana. This is the base to collect first data and experiences – and for the future there’s probably a lot to improve!